So you want to participate in the App Competition! Chances are that you have visited the European Data Portal and were overwhelmed with the roughly 400.000 available datasets. In other datablogs we will delve into the available EU decision-making and financial data, but in this datablog we will take a look at two of the many other topics: public health and the environment.
Public Health
Public health and healthcare in general are hot topics. Every country wants better healthcare without spending too much. So, think of tools which give insight into the availability, quality and cost of healthcare. There are datasets which detail the spending for an entire country, the available health services in Italy or the number of hospitalized patients in Germany. Even the costs for several cities of funerals for people if no one else could pay for it.
Remember that the European Data Portal does not contain all open data. Once you’re interested in a certain topic, make sure to look for data in national or local open data portals. E.g., all healthcare data from the German or Irish portal. To facilitate this search, don’t forget to make use of your favourite search engine or look at other collections of open data websites like Engage or Open Data Inception (make sure that the open data comes from a government body in the EU though, whether it is local, national or supranational institution!).
Environment
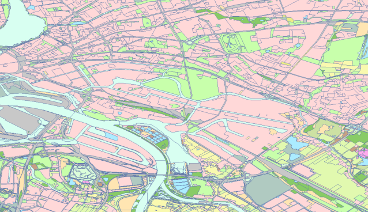
Many environment related datasets contain geographic information. These datasets often use the WMS (Web Map Service) or WFS (Web Feature Service) format, which are an API specification which respectively retrieve (parts of) maps and raw geographical information. The European Open Data Portal provides a great preview function where you can easily view WMS datasets on a map. Click on the globe icon next to a WMS dataset to access it. For example, check out this map with with many countrywide layers in Switzerland. They provide a layer, ‘Strassenverkehrslärm Tag’, which shows the estimated road noise during the day, the locations of GMS/3G/4G cell tower (search for ‘Antennenstandorte’ layers) or things like the depth of the soil (Gründigkeit) and how well potatoes or maize will grow in an area (Klimaeignung Kartoffeln/Körnermais). The German state of Rhineland-Palatinate provides a map containing the locations of geography related touristic locations. And let’s conclude with the 193(!) available maps for Vienna, ranging from the wheelchair accessibility of side-walks to their ecological network.
WMS only returns map images, while WFS returns the raw geographic data. So if you don’t need to modify the image, use WMS, but if you want control over how the map looks or if you need to modify it then use WFS. While the preview function of the European Data Portal offers a great way to quickly examine the available data, you might want to use a program like QGIS to further explore and visualize the data. Check out this documentation on how to load a WMS or a WFS into QGIS. Once you’re up to integrating the data into your application you might want to read tutorials and documentation on how provide specific queries to WMS and WFS.
Final remarks
When browsing the European Open Data Portal (or any data portal for that matter), you will notice that not all the data which you are looking for is available. Some countries or institutions follow all best practices for datasets on a certain topic, while others don’t. Different datasets will use different formats and standards. You will find broken links (tip: type the name/description of the dataset in a search engine). This can be frustrating when you want to combine datasets from multiple EU countries. But as more and more open data is released new opportunities arise for innovative applications which can make governments more transparent, accountable and understandable or which create economic value.
